微信小程序中使用echarts以及踩坑總結(jié)(附源碼)
人在家中坐,鍋從天上來。
半個(gè)月前本來在家寫著一個(gè)項(xiàng)目,還沒來得及提測,領(lǐng)導(dǎo)突然一個(gè)電話,需要立刻去支援另一個(gè)項(xiàng)目,一打聽,一個(gè)爛尾半年的項(xiàng)目,縱使內(nèi)心不愿意,還是要去啊。因?yàn)轸斞刚f過,生活就像強(qiáng)奸,既然不能反抗,那就好好享受吧。
這個(gè)項(xiàng)目分為PC端、用戶端小程序和商家端小程序,這里主要講講在商家端中的某個(gè)模塊,需要用到數(shù)據(jù)統(tǒng)計(jì)圖表,當(dāng)時(shí)覺得有兩個(gè)插件不錯(cuò):
- 百度 echarts
- 阿里 AntV
因?yàn)橹霸陧?xiàng)目中使用 echarts 比較多,所以最終選擇了 echarts 作為項(xiàng)目中的圖表插件。
echarts的引入
我是按照 echarts 官網(wǎng)教程來引入的,很簡單,不多說。 傳送門
echarts中使用多個(gè)圖表
wxml代碼如下:
<!--圖表1-->
<view class="echarts-container" hidden="{{!isShoweyes || !echartsData.totalRecentRansactions.allTotalMoney}}">
    <ec-canvas id="mychart-dom-turnover" canvas-id="mychart-turnover" ec="{{ turnoverEc }}"></ec-canvas>
</view>
<!--圖表2-->
<view class="echarts-container" hidden="{{!isShoweyes || !echartsData.shopNewCustomerRespVo.allNewCustomer}}">
    <ec-canvas id="mychart-dom-customer" canvas-id="mychart-customer" ec="{{ customerEc }}"></ec-canvas>
</view>
<!--圖表3-->
<view class="echarts-container" hidden="{{!isShoweyes || !echartsData.customerOrderAverageRespVo.customerAverage}}">
    <ec-canvas id="mychart-dom-price" canvas-id="mychart-price" ec="{{ priceEc }}"></ec-canvas>
</view>
js代碼如下
<!--通過lazyLoad設(shè)置圖表懶加載-->
data: {
    isShoweyes: true,
    turnoverEc: {
      lazyLoad: true,
    },
    customerEc: {
      lazyLoad: true,
    },
    priceEc: {
      lazyLoad: true,
    },
    echartsData: {}
  },

<!--頁面加載時(shí)創(chuàng)建對應(yīng)的canvas面板-->
onLoad: function (options) {
    this.echartsComponnet1 = this.selectComponent('#mychart-dom-turnover');
    this.echartsComponnet2 = this.selectComponent('#mychart-dom-customer');
    this.echartsComponnet3 = this.selectComponent('#mychart-dom-price');
  },
  <!--獲取到數(shù)據(jù)后,初始化報(bào)表-->
  getData: function () {
    //  .... 獲取數(shù)據(jù)

    <!--此用循環(huán)初始化幾個(gè)圖表-->
    for (let i = 1; i < 4; i++) {
        if (!Chart[i]) {
          this.initEcharts(i); //初始化圖表
        } else {
          this.setOption(i); //更新數(shù)據(jù)
        }
      }
  },
  <!--//初始化圖表-->
  initEcharts: function (i) {
    this['echartsComponnet' + i].init((canvas, width, height) => {
      // 初始化圖表
      Chart[i - 1] = echarts.init(canvas, null, {
        width: width,
        height: height
      });
      this.setOption(i);
      // 注意這里一定要返回 chart 實(shí)例,否則會影響事件處理等
      return Chart[i - 1];
    });
  },
  setOption: function (i) {
    Chart[i - 1].clear(); // 清除
    Chart[i - 1].setOption(this['getOption' + i]()); //獲取新數(shù)據(jù)
  },

  <!--設(shè)置報(bào)表需要的配置項(xiàng)-->
  getOption1() {
    let {
      echartsData
    } = this.data;
    return {
      color: ['#0179FF'],
      tooltip: {
        trigger: 'axis',
        axisPointer: { // 坐標(biāo)軸指示器,坐標(biāo)軸觸發(fā)有效
          type: 'shadow', // 默認(rèn)為直線,可選為:'line' | 'shadow'
          shadowStyle: {
            opacity: 0.8
          }
        },
        formatter: this.formatterTooltip,
        position: this.setTooltipPositionfunction
      },
      grid: {
        left: 20,
        right: 20,
        bottom: 15,
        top: 40,
        containLabel: true
      },
      xAxis: [{
        type: 'category',
        axisLine: {
          lineStyle: {
            color: '#999',
          }
        },
        axisLabel: {
          color: '#666',
        },
        data: echartsData.totalRecentRansactions.dates,
      }
      ],
      yAxis: [{
        type: 'value',
        axisTick: {
          show: false
        },
        axisLine: {
          show: false,
          lineStyle: {
            color: '#999',
          }
        },
        axisLabel: {
          color: '#666',
          fontSize: 13
        }
      }],
      series: [{
        name: '訂單總額',
        type: 'line',
        label: {
          normal: {
            show: true,// 是否在折線點(diǎn)上顯示數(shù)值
            position: 'inside'
          }
        },
        data: echartsData.totalRecentRansactions.allTotalMoney
      }]
    };
  }
遇到的坑
1.Tooltip支持不好
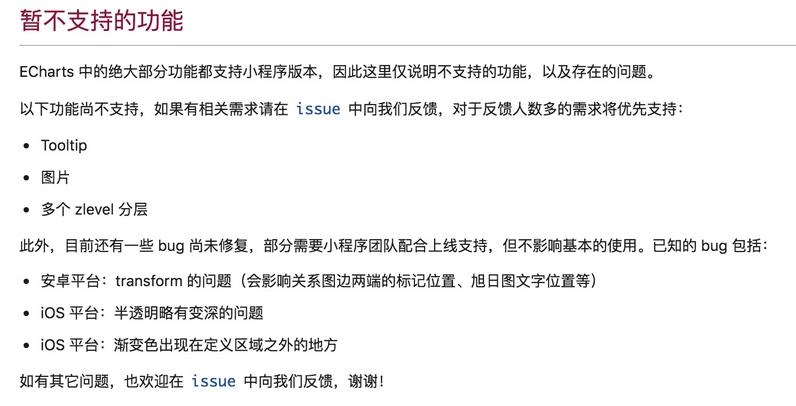
雖然官網(wǎng)上echarts暫時(shí)不支持 Tooltip ,但是經(jīng)過試驗(yàn),還是 Tooltip 還是有效果的,但是,x軸對應(yīng)的坐標(biāo)值并不會顯示在 Tooltip 中,需要使用 Tooltip 的 formatter 函數(shù),自己處理需要展示的數(shù)據(jù),代碼如下:
// 格式化Tooltip
  formatterTooltip(param) {
    return "日期:" + param[0].name + "\n" + param[0].seriesName + ": " + param[0].data
  },
2.當(dāng)點(diǎn)擊靠近屏幕右側(cè)或者底部的item項(xiàng)時(shí), Tooltip 會溢出邊界,解決辦法:
給 Tooltip 的 position 函數(shù)返回一個(gè)根據(jù)點(diǎn)擊位置計(jì)算的坐標(biāo)點(diǎn),(也可以給一個(gè)固定的位置,但是體驗(yàn)不好)
// 更改Tooltip的位置,處理邊界超出的情況
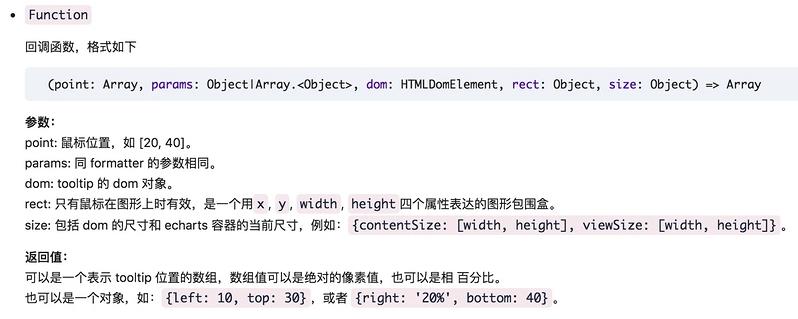
setTooltipPositionfunction(point, params, dom, rect, size) {
//其中point為當(dāng)前鼠標(biāo)的位置,size中有兩個(gè)屬性:viewSize和contentSize,分別為外層div和tooltip提示框的大小
// 更改提示框的顯示位置
let x = point[0];//
let y = point[1];
// size: 包括 dom 的尺寸和 echarts 容器的當(dāng)前尺寸,例如:{contentSize: [width, height], viewSize: [width, height]}
let boxWidth = size.contentSize[0];
// let boxHeight = size.contentSize[1]; // size里面此處獲取不到dom的高度,值為NAN,所以下面指定了一個(gè)固定值
let boxHeight = 50;
let posX = 0;//x坐標(biāo)位置
let posY = 0;//y坐標(biāo)位置
if (x < boxWidth) {//左邊放不開
posX = 5;
} else {//左邊放的下
posX = x - boxWidth;
}
if (y < boxHeight) {//上邊放不開
posY = 5;
} else {//上邊放得下
posY = y - boxHeight;
}
return [posX, posY];
},
上面需要注意的是,獲取 dom 的高度,官方上說的是可以從 position 回調(diào)函數(shù)的 size 參數(shù)中獲取到 dom 的高度,但是我打印出來卻是 NAN 。
打印出來結(jié)果:
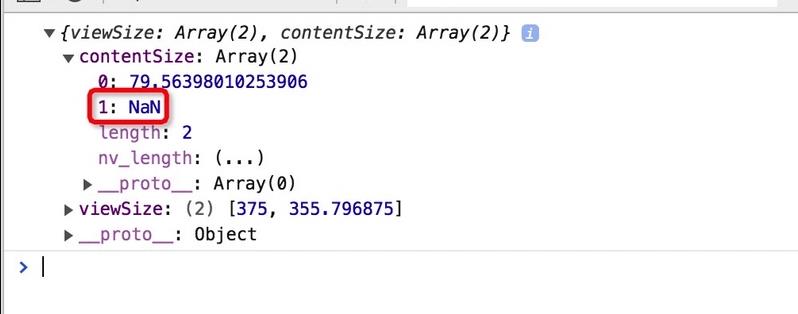
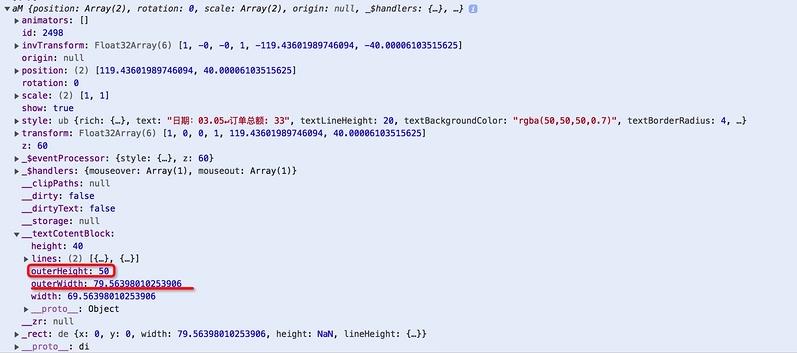
后來發(fā)現(xiàn)參數(shù) params 中 outerWidth 的值和參數(shù) size 中 contentSize 的寬度值相同,所以果斷取參數(shù) params 中的 outerHeight 作為 dom 的高度,最后運(yùn)行的效果確實(shí)沒有問題。
3.左右滑動(dòng)柱狀圖時(shí),柱狀圖畫板會變空白,點(diǎn)一下空白又會出現(xiàn)柱狀圖,而且這個(gè)問題只有在柱狀圖上出現(xiàn)!
剛開始以為是自己代碼的問題,后來自己檢查了幾遍,確實(shí)沒什么問題,然后掃碼體驗(yàn)了官方的小程序demo,發(fā)現(xiàn)也有這個(gè)問題,頓時(shí)只想對它口吐芬芳。既然是官方代碼自身的問題,于是去看了下源碼,如下:
<canvas class="ec-canvas" canvas-id="{{ canvasId }}" bindinit="init" bindtouchstart="{{ ec.disableTouch ? '' : 'touchStart' }}" bindtouchmove="{{ ec.disableTouch ? '' : 'touchMove' }}" bindtouchend="{{ ec.disableTouch ? '' : 'touchEnd' }}"></canvas>
官方代碼給畫布綁定一個(gè) bindtouchmove 事件
touchMove(e) {
      if (this.chart && e.touches.length > 0) {
        var touch = e.touches[0];
        var handler = this.chart.getZr().handler;
        handler.dispatch('mousemove', {
          zrX: touch.x,
          zrY: touch.y
        });
        handler.processGesture(wrapTouch(e), 'change');
      }
    },
這里面又去調(diào)用了 echarts.js 中的方法,最后想了一個(gè)粗暴的解決辦法:
刪掉源碼中的bindtouchmove事件
完美解決,哈哈或或紅紅火火恍恍惚惚~~~

以上就是我在小程序中使用echarts遇到的坑,希望能幫到后來踩坑的人。
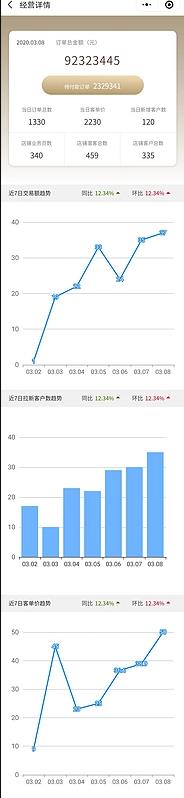
最終效果圖片
Demo源碼